
When discussing immigration in the United States, the debate often falls into two camps: on one side are the so-called 'sanctuary states,' which limit the collaboration of local police with federal immigration authorities such as Immigration and Customs Enforcement (ICE), and on the other side are the non-sanctuary states, which actively cooperate with the central government to detain and hand over immigrants.
However, if we examine immigration detention data nationwide, the picture becomes much more complex. According to official ICE reports, between 2025 and the first part of 2026, more than 1 million people were detained in the United States. However, these arrests are not evenly distributed and, on the contrary, are heavily concentrated in certain states that serve as key hubs within the national immigration detention system.
The 287(g) agreements allow local agencies to collaborate with ICE, but when analyzing arrest data between 2025 and the current year of 2026, a key question arises: does this program really translate into more arrests and deportations?
When cross-referencing the number of agreements with the number of arrests, the data suggests that having more agreements does not always mean registering more immigration arrests, and in many cases, arrests seem to depend more on factors such as proximity to the border, the presence of detention centers, or the infrastructure of the federal immigration system.
States like Texas, Louisiana, California, Georgia, and Arizona appear time and again among the places where the highest number of ICE arrests are concentrated, and although the numbers are not as high in so-called sanctuary states, the data shows that arrests also occur there, even in territories where local authorities limit their cooperation with federal immigration agencies.
For example, California (which is considered a sanctuary state) continues to register high numbers of arrests. This shows that state policies do not completely determine how the immigration detention system works in the United States, and even if a state limits its police collaboration with ICE, the federal government maintains its own infrastructure, detention centers, and operational capacity.
And that raises a key question: how is the ICE immigration detention system working in sanctuary states, and to what extent do 287(g) agreements influence arrest and deportation figures in the United States?
To answer this, the report analyzes state data on arrests, the presence of detention centers, and the role played by the 287g cooperation agreement. in different parts of the country, with complete analysis of the data reported directly by ICE.
Immigration detentions in sanctuary states: high numbers even without formal cooperation
An analysis of ICE-reported arrest data between 2025 and 2026 shows that sanctuary states recorded a total of 248,349 people detained by ICE. Immigration and Customs Enforcement (ICE ) demonstrates that the federal agency's presence is maintained even in places where local authorities limit their cooperation.
When comparing sanctuary states that have 287g agreements with ICE and those that do not, a striking fact emerges: the number of arrests is almost the same in both cases.
In states without agreements, such as California, Washington, Hawaii, Rhode Island, and Vermont, 125,089 arrests were recorded, despite the lack of formal cooperation with ICE. In contrast, in states with agreements, the number of arrests reached 123,260, with a total of 48 active cases.
-
States without agreements 287g: 125,089 arrests - 50.3% of total arrests.
-
States with 287g agreements: 123,260 arrests - 49.7% of total arrests.
-
Number of agreements: 48
In simple terms, this shows that having agreements with ICE does not necessarily mean there will be more arrests (at least in sanctuary states) because even in those where local authorities do not formally collaborate with immigration, arrests continue to occur in numbers very similar to territories where there are agreements in place.
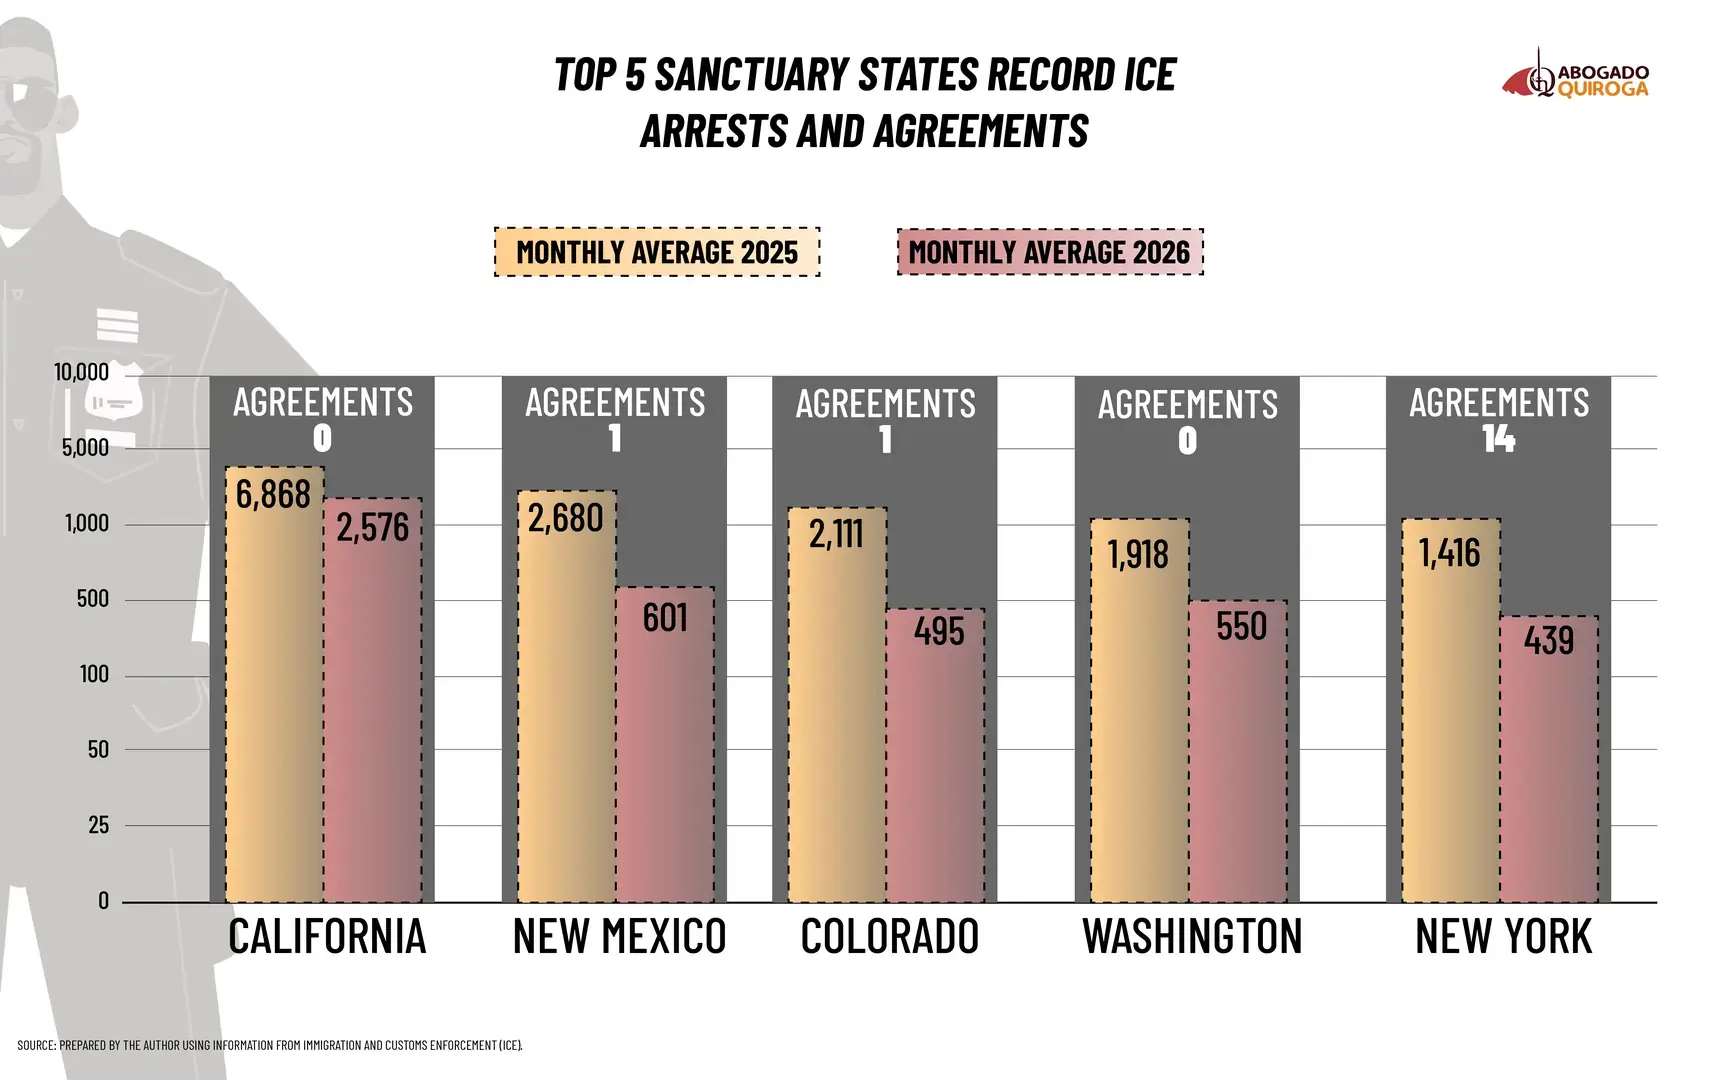
For example, in California, where there are no current 287(g) agreements with ICE and it is considered a sanctuary state, 82,426 arrests were recorded during fiscal year 2025 and 12,882 arrests have been made so far in fiscal year 2026. This means that, in just the first few months of fiscal year 2026, approximately 15.6% of the total arrests recorded in all of 2025 have already been reached.
Looking at the monthly rate, 2025 saw an average of approximately 6,869 arrests per month, while in 2026 the figure is around 2,147 monthly arrests. The data suggests that, at least for now, the rate of arrests in the state is lower than that observed during the previous fiscal year, despite it being one of the states with the highest number of immigration arrests in the country.
Next is New Mexico, with a 287(g) agreement and 35,175 arrests, representing 14% of the total; followed by Colorado, also with a current agreement, which recorded 27,808 arrests, equivalent to almost 11%. In contrast, Washington, which has no cooperation agreements with ICE, reports 25,767 arrests, or about 10.3% of the total.
In the case of New Mexico, which has only one 287g agreement with ICE, 32,169 arrests were reported in 2025, which is equivalent to an average of 2,680 arrests per month, and so far in 2026, 3,006 arrests have been recorded, with an approximate average of 501 per month, for a total of 35,175 in both years.
Conversely, Utah, with 16 signed agreements, recorded 263 arrests in 2025, equivalent to 22 arrests per month, and 65 so far in 2026, representing 11 arrests per month, for a total of 328 arrests in both years. This figure demonstrates that a greater number of signed cooperation agreements does not necessarily translate into higher arrest rates, as in this case, the monthly average is reduced by 50%.
These numbers help us understand that the size of the state, its geographic location, and the infrastructure maintained by the federal government in each of them can have a greater influence than simply not cooperating with ICE. In the case of states like California or New Mexico, their proximity to the southern border and the historical presence of immigration detention centers help explain why they continue to appear among the places with the highest number of arrests.
The states that account for many immigration detentions: Texas leads the way
To understand the impact of sanctuary states that maintain agreements with ICE, one must look at the national picture. ICE arrests between fiscal year 2025 and the first half of fiscal year 2026 totaled 1,156,275 people. In 2025, 1,022,435 arrests were recorded, representing 88.4% of the total, while so far in fiscal year 2026, 133,840 arrests have been reported, equivalent to 11.6%. If the current rate continues, the year could end with approximately 800,000 arrests, representing a reduction of roughly 20% compared to 2025.
While in 2025, ICE made more than 85,000 arrests per month nationwide (sanctuary and non-sanctuary), on average, this year the rate falls to about 22,000 per month and if the trend continues, the year could end with around 260,000 arrests, well below the volume recorded in 2025, but a large part of these arrests are concentrated in a few states that repeatedly appear among the top places.
Difference between sanctuary and non-sanctuary states
When the data is broken down by state policy type, it is observed that the majority of immigration detentions occur in non-sanctuary states. Between 2025 and the first part of 2026, these states accounted for 907,926 arrests, representing approximately 78.5% of the national total.
In contrast, sanctuary states account for approximately 248,349 arrests, equivalent to roughly 21.5% of the total.
Non-sanctuary states
The highest numbers are concentrated in a small group of states: Texas and Louisiana lead by a wide margin in detentions, followed by Georgia, Arizona and Florida; precisely in these territories, factors such as proximity to the southern border, the presence of large detention centers and higher levels of cooperation with the federal immigration system have an influence.
As expected, the data shows that 4 out of 5 immigration arrests in the United States occur in non-sanctuary states; however, one out of every five arrests still occur in sanctuary states, which demonstrates that immigration law enforcement remains primarily federal and does not depend solely on local policy.
Top 10 states with the most ICE arrests across the US
A closer look at the ten states with the most people detained between 2025 and the first part of 2026 reveals a high geographic concentration of the immigration detention system. Collectively, these ten states account for 961,142 detentions, representing approximately 83% of all immigration arrests recorded nationwide during these two fiscal years (2025-2026).
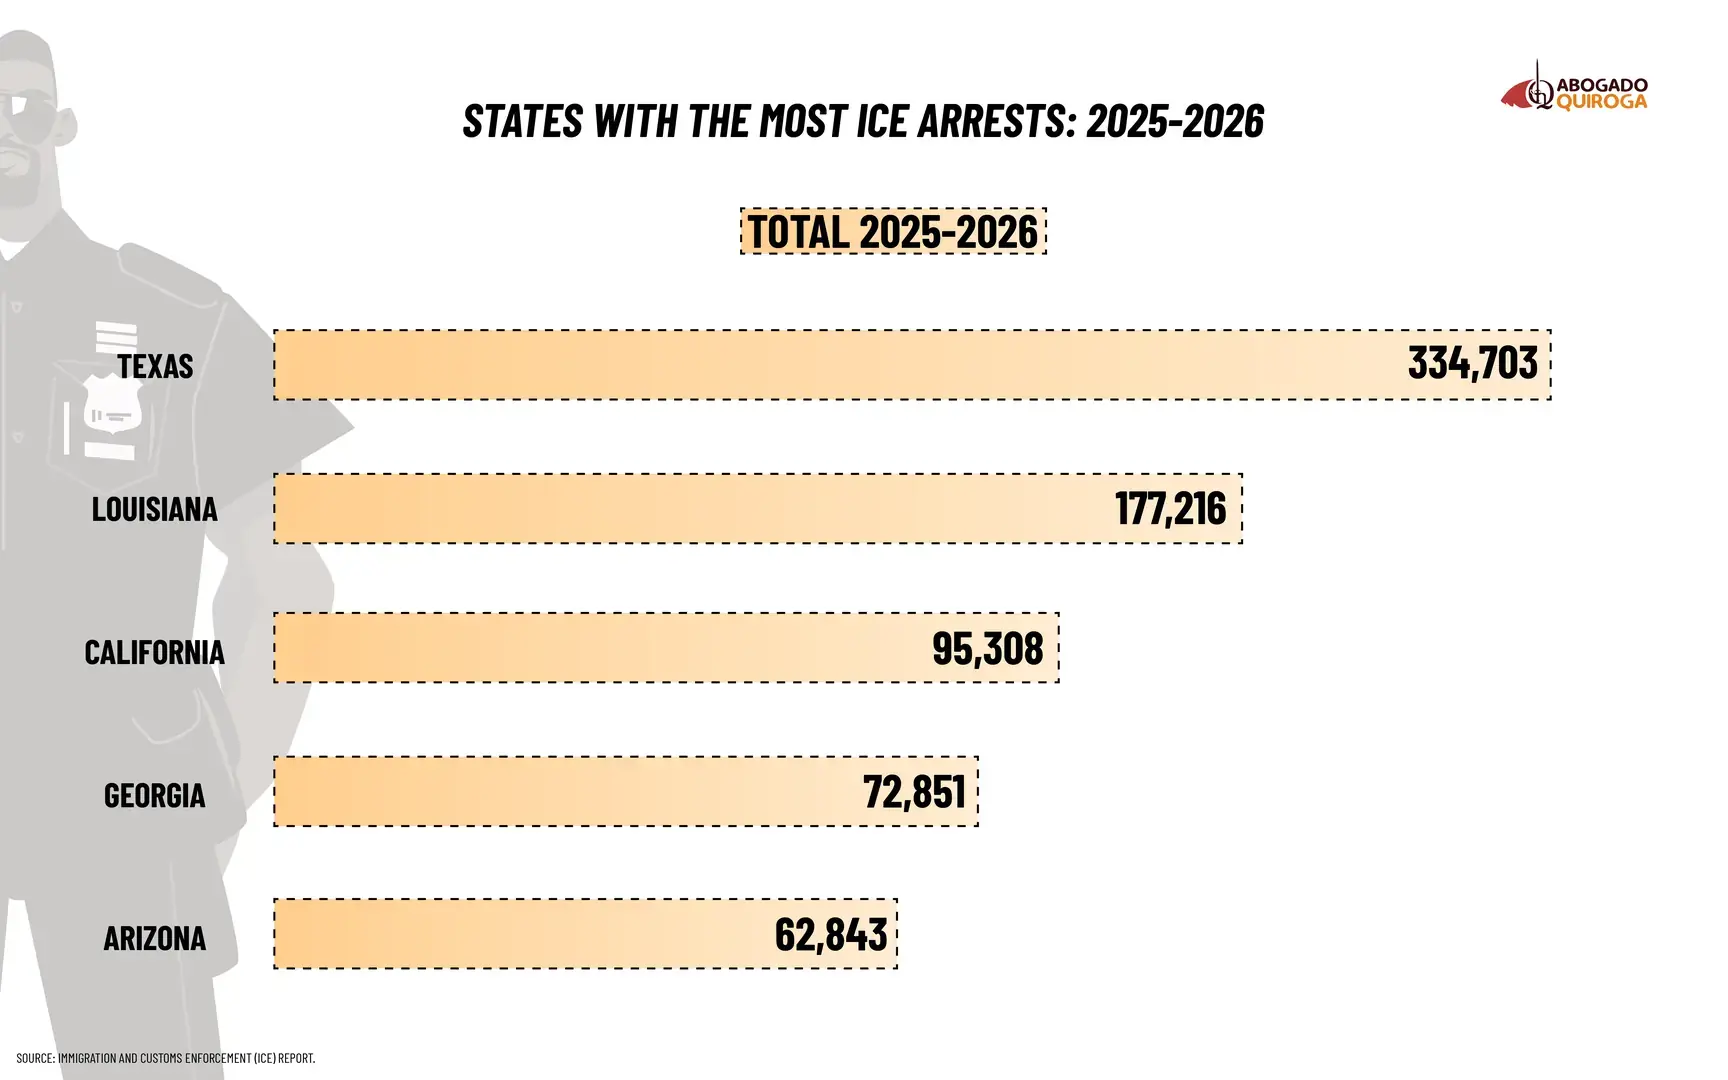
Within this group, Texas dominates the system, with 334,703 arrests, representing almost 29% of the national total, and if Louisiana, which ranks second with 177,216 arrests, is added, both account for about 44% of all arrests in the country.
Sanctuary states within the top 10
Although most of the states in the ranking are not sanctuary states, three territories with that status appear in the top ten:
-
California: 95,308 arrests
-
New Mexico: 35,175
-
Colorado: 27,808
Together, these three states account for 158,291 arrests, contributing about 16% of the arrests within the top 10 and about 14% of the national total.
The impact of 287(g) outside of sanctuary states
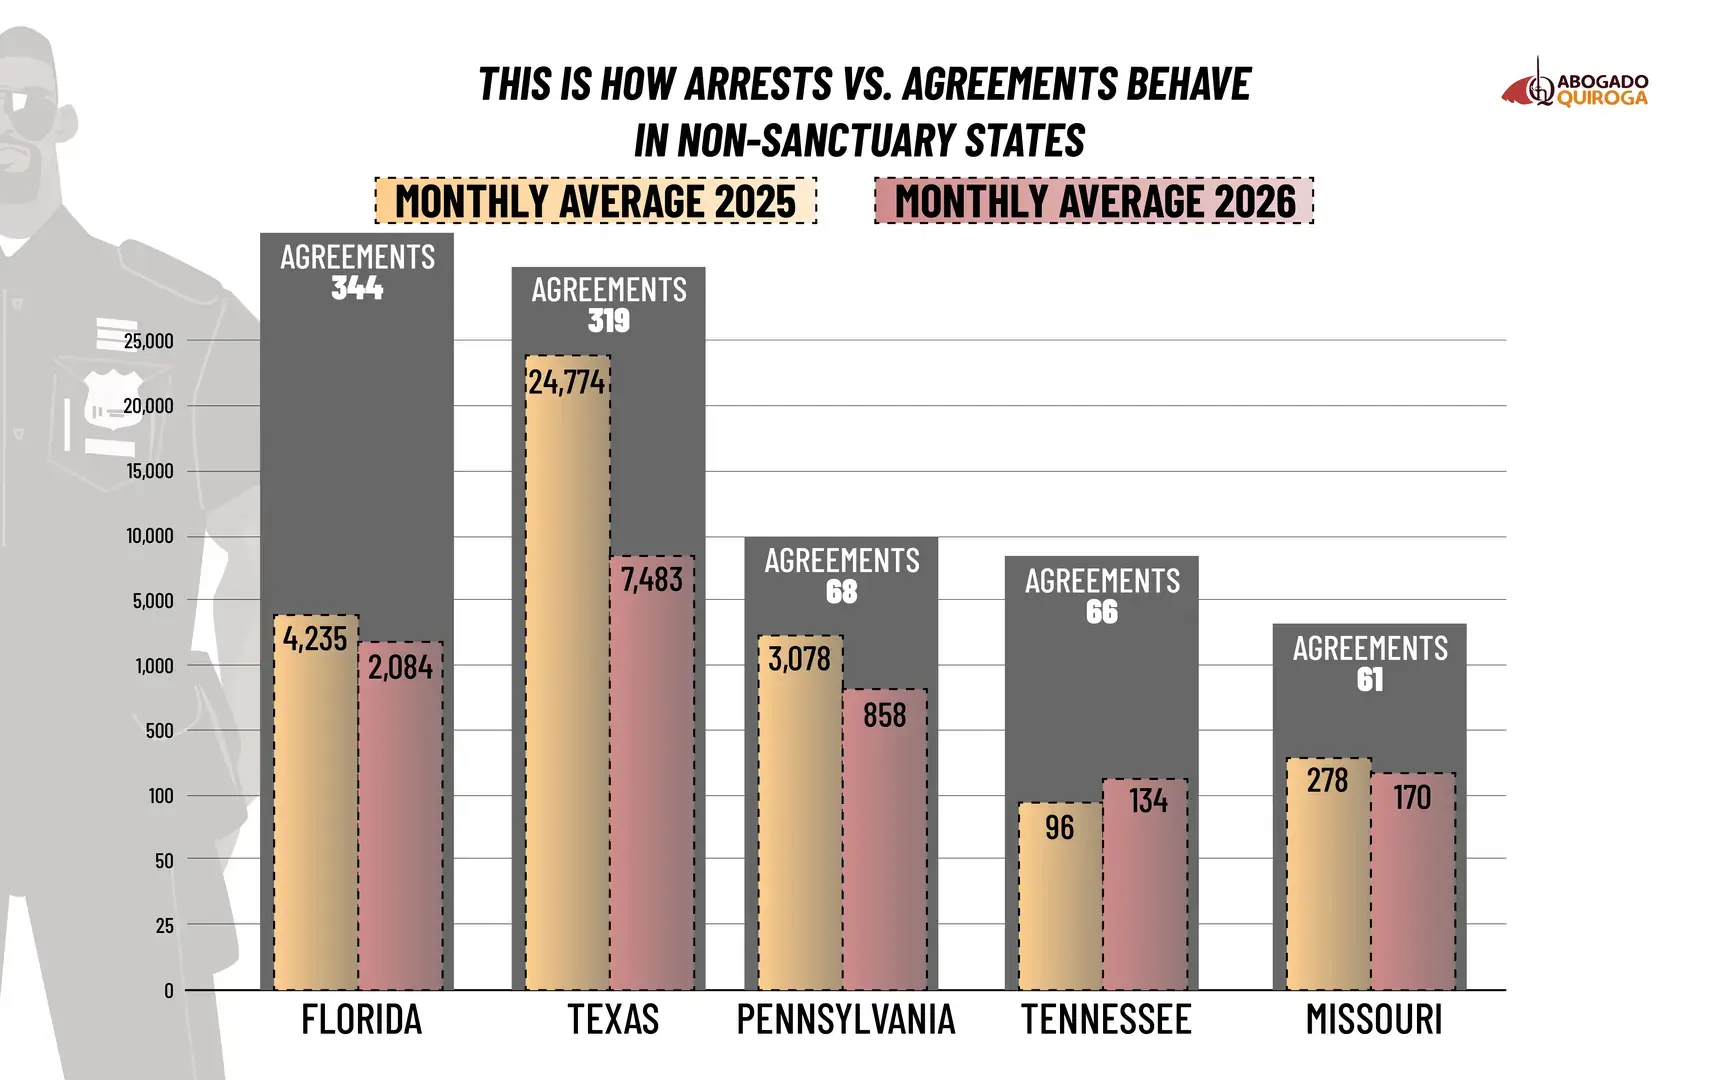
In the non-sanctuary category, the states with the highest number of 287(g) agreements are Florida (344), Texas (319), Pennsylvania (68), Tennessee (66), Missouri (61), Georgia (57), and Alabama (54). In some of these cases, a high number of agreements coincides with a high volume of arrests. For example, Texas recorded 297,287 arrests in 2025, which equates to an approximate average of 24,774 arrests per month. In 2026, it has accumulated 37,416 arrests, representing approximately 7,483 arrests per month so far. Florida, with the highest number of signed agreements, recorded an average of approximately 4,235 arrests per month in 2025, while in 2026 the average is 2,084 per month. In Georgia, with 57 agreements, the average was approximately 5,371 arrests per month in 2025, compared to 1,681 per month in 2026. In terms of monthly averages, the available figures show that arrests recorded so far in fiscal year 2026 are significantly lower than those in fiscal year 2025, even in jurisdictions with a high number of 287(g) agreements. This suggests that it cannot be concluded that a higher number of agreements produces an increase in the monthly rate of arrests.
Other examples include Tennessee, which, with 66 agreements, recorded around 96 arrests per month in 2025, while in 2026 the average is 134 per month. Missouri, with 61 agreements, had approximately 278 arrests per month in 2025, compared to 170 per month in 2026. In Alabama, with 54 agreements, the average was 126 arrests per month in 2025 and about 55 per month in 2026.
Consequently, although states with more agreements also concentrate large volumes of arrests in absolute terms, analysis of the monthly average indicates that the number of agreements alone does not appear to explain an increase in detentions , and that other factors (such as the size of the migrant population, the intensity of ICE operations, or the time of the fiscal year in which the numbers are recorded) could be influencing the observed results.
Looking at non-sanctuary states with few signed agreements also reveals varied results. Iowa, with only two agreements, recorded 2,624 arrests in 2025, an average of about 219 arrests per month, while in 2026 it accumulated 520 arrests, about 104 per month. Nebraska, with six agreements, had 1,522 arrests in 2025 (around 127 per month) and 418 in 2026, approximately 84 per month. Michigan, with seven agreements, recorded 13,181 arrests in 2025, representing about 1,098 arrests per month, while in 2026 it accumulated 3,602 arrests, equivalent to about 720 per month.
The data shows that states with many agreements may register relatively low monthly averages, while others with fewer agreements present higher figures.
Detention centers and their strategic role in the migration system
If we give a name to detention in the United States, the centers that set the standard are few, but strategic and are not distributed homogeneously, but are concentrated in a small number of facilities located mainly in southern states and near the border.
2025: strong concentration in the south of the country
In 2025, the ten detention centers with the most people detained accounted for approximately 18,194 arrests. The top-ranked center, ERO El Paso Camp East Montana in Texas, alone recorded 2,953 arrests, representing about 16% of the total detentions at the top ten centers.
Texas appears as one of the most relevant territories in the system with two centers within the top 10, followed by states such as California, Louisiana and Mississippi, which also concentrate facilities with high levels of detention.
2026: Changes in the leadership of detention centers
So far in 2026, the leadership changes as the center with the most detainees becomes Adams County Detention Center in Mississippi, with about 2,170 detainees, followed by Stewart Detention Center in Georgia and the South Texas ICE Processing Center in Texas.
The ten busiest centers account for approximately 15,119 arrests, meaning that a large part of the detention system continues to be concentrated in a small group of strategic facilities.
The ranking also shows the entry of new centers, such as the Eloy Federal Contract Facility in Arizona and the Denver Contract Detention Facility in Colorado, indicating that the detention network can shift or redistribute operations depending on ICE's operational needs.
Behind the numbers: why more deals with ICE don't always mean more immigration arrests
The data analyzed in this report show that the immigration detention system in the United States is far from relying solely on cooperation agreements with ICE. Although 40 states maintain 1,495 active 287(g) agreements, arrest figures do not always follow that same pattern.
It suffices to look at states without formal agreements: arrests continue at similar levels. In the sanctuary states analyzed, for example, 125,089 arrests were recorded in territories without agreements, compared to 123,260 arrests in states that do have them. The difference is minimal and suggests that these agreements alone do not determine the volume of immigration arrests.
When the view is broadened to the entire country, the pattern becomes even more evident. Between 2025 and the first part of 2026, ICE made 1,156,275 arrests, but more than 83% of them were concentrated in just ten states.
Texas alone accounts for 334,703 arrests (almost 29% of the total). Together with Louisiana, which has 177,216, these two states represent approximately 44 % of all arrests in the country. This concentration coincides with the presence of large detention centers, proximity to the southern border, and robust federal infrastructure, factors that appear to carry more weight than the number of agreements signed.
In other words, the data suggest that geography, infrastructure, and the operational capacity of the federal government have a greater influence on arrest numbers than the number of 287(g) agreements.
The contrasts between states clearly reflect this. Some territories with numerous agreements register relatively few arrests. Utah, for example, has 16 agreements and only 328 arrests. In contrast, California, where there are no statewide 287(g) agreements, continues to rank among the states with the highest number of arrests in the country.