

From the Obama administration to Donald Trump's second presidency, US immigration policy has undergone profound changes in how immigrants are arrested, detained, and deported. Now, with the first data available for fiscal year 2026, a picture is emerging that suggests the Trump administration is on track to take deportations to levels not seen since the most intense years of the Obama era.
Just look at the figures from mid-2026. By then, Immigration and Customs Enforcement (ICE) had already recorded more than 350,000 deportations, a figure that exceeds the total of several previous fiscal years and puts the agency on track to approach or even surpass the more than 430,000 expulsions recorded in 2013, the Obama-era record.
But the number of deportations is only part of the story. To understand how much U.S. immigration policy has truly changed, it's necessary to look at what happens before each removal: how many people are arrested, who is detained, and where the operations are concentrated.
Therefore, this research compares data from the Obama, Trump, Biden, and Trump 2.0 administrations to identify not only which government deported the most people, but also how the machinery used to do so changed and what the profile and location of the affected immigrants has been.
The evolution of deportations: from Obama to Trump 2.0
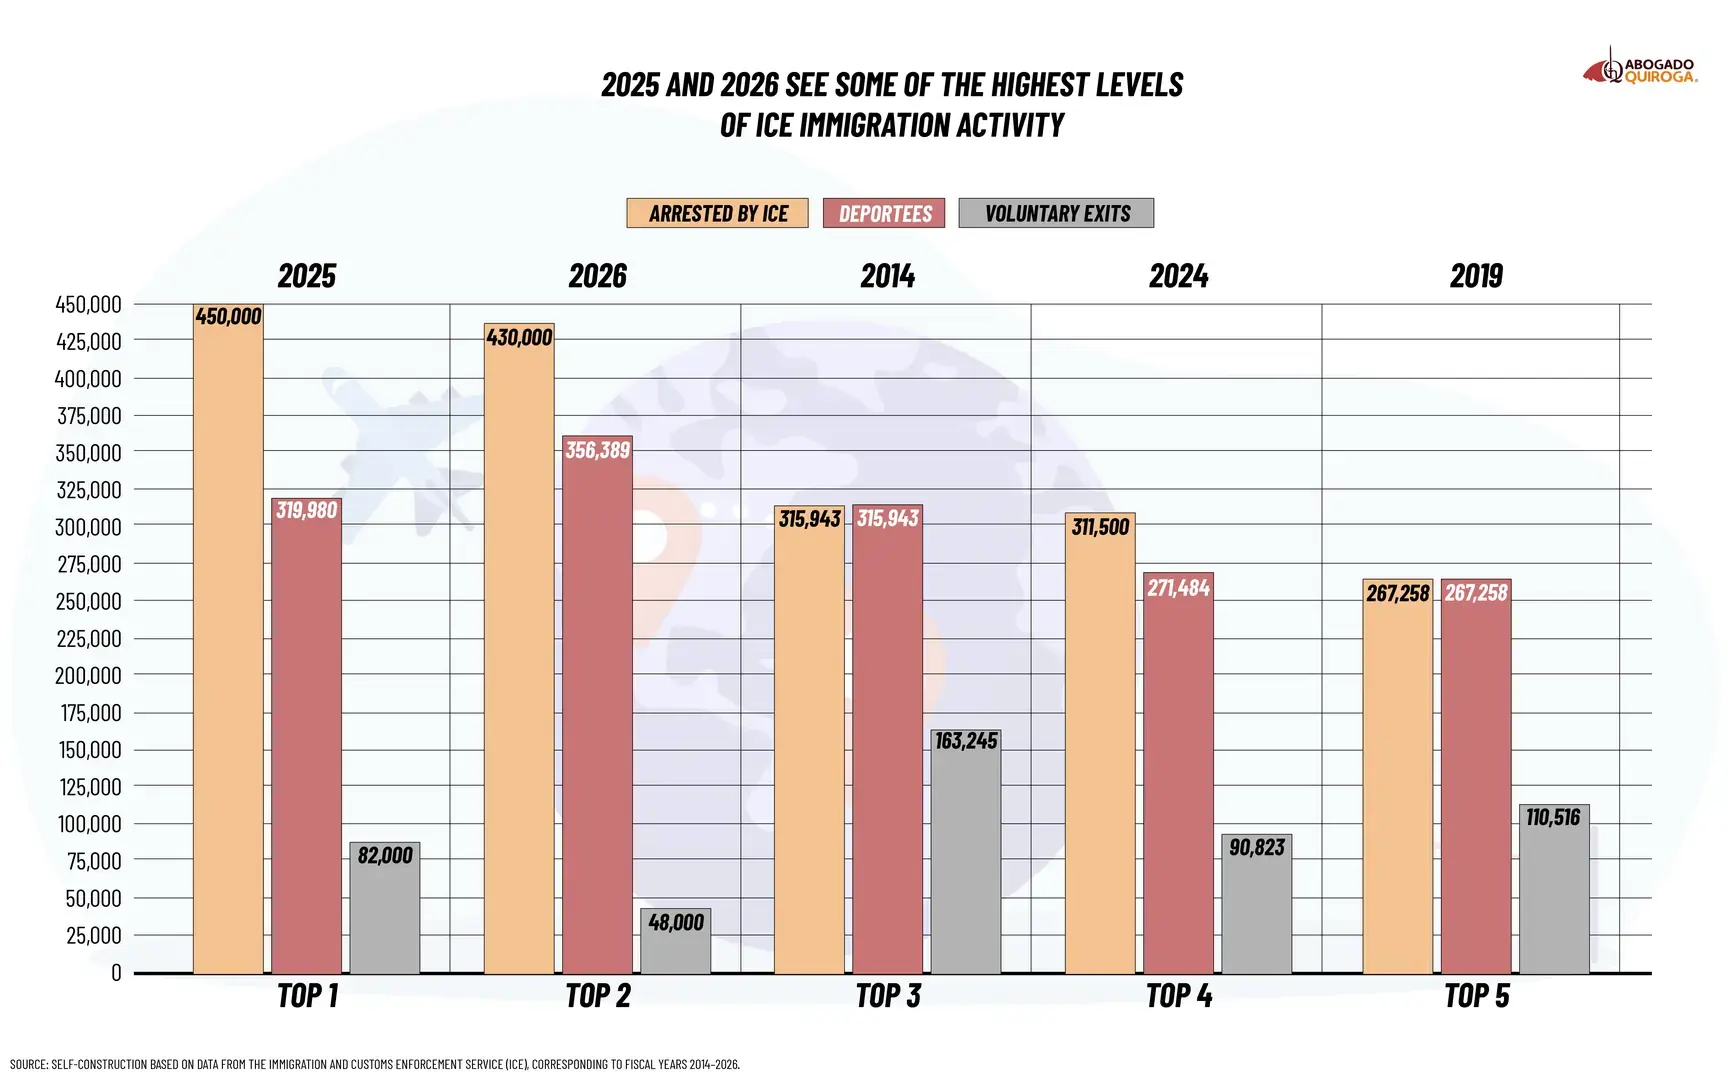
The evolution of ICE deportations reveals several clearly distinct periods. The first corresponds to the period between 2014 and 2019, during the final years of the Obama administration and the beginning of the first Trump administration, when deportations remained at high levels, averaging close to 256,000 per year.
Subsequently, between 2020 and 2021, the figures fell significantly, reaching their lowest level of the entire period analyzed. A recovery began in 2022, accelerating particularly in 2023 and 2024. Finally, in 2025 and 2026, deportations increased again, reaching levels higher than several of those recorded during the previous decade.
Deportations: from historic decline to accelerated growth
Between 2014 and 2019, deportations remained relatively stable, although the period was marked by years of decline and recovery. In 2014, ICE recorded 315,943 deportations. A year later, the figure fell 25 % to 235,413. In 2016, it rose slightly again, exceeding 240,000 removals, while in 2017 it decreased once more by 6 %.
Then came a recovery. In 2018, deportations grew by 13 %, reaching 256,085, and in 2019 they increased another 4 %, with 267,250 expulsions.
However, this trend reversed completely in 2020. Deportations fell by 30 %, and in 2021, the steepest decline of the entire period occurred, with a 68 % reduction in a single year. The COVID-19 pandemic and the restrictions that affected international travel help explain part of this drop: ICE went from 185,884 deportations in 2020 to just 59,011 in 2021.
In 2022, the situation began to change. Deportations increased by 22 %, reaching 72,177 cases. But the most significant jump came in 2023, when they increased by 98 % in a single year, rising from 72,177 to 142,580.
In 2024, something similar occurred. Deportations increased by 90 %, reaching 271,484. Thus, during the final years of the Biden administration, deportations practically quadrupled in just two years.
After that jump, the growth continued. In 2025, deportations increased by 18 %, reaching 319,980. By 2026, the available cumulative data already reached 356,389 deportations, a figure that even surpasses the total recorded during all of 2014, even though the fiscal year had not yet ended.
This means that, after hitting rock bottom in 2021, deportations not only recovered, but returned to a scale comparable to some of the most intense years of the previous decade.
Voluntary departures: the opposite of expulsions
While deportations tell a story of growth, voluntary departures show a much more irregular trajectory.
In 2014, 163,245 voluntary departures were recorded. From that point on, a decline began that continued in subsequent years. In 2015, 129,726 departures were recorded, 33,519 fewer than the previous year, a reduction of 21 %. By 2016, they had fallen again to 106,772, a decrease of 18 %.
The trend continued in 2017, when voluntary departures fell to 98,106, that is, 8,666 less than in 2016. In 2018, the drop was smaller and 96,045 were recorded, just 2,061 less than the previous year.
In 2019, there was a slight upturn. Voluntary departures increased by 15 %, reaching 110,516, which is 14,471 more than in 2018.
But in 2020 the number plummeted again. Voluntary departures fell by 57 %, from 110,516 to just 47,381. This represents a reduction of 63,135 cases in a single year.
The decline became even more pronounced in 2021. That year, only 11,225 voluntary departures were recorded, 36,156 fewer than in 2020, representing a reduction of 76 %.
Compared to 2014, when 163,245 voluntary departures were recorded, the decrease up to 2021 was 152,020 cases, equivalent to approximately 93 %. That was the lowest point of the entire period analyzed.
A recovery began in 2022. Voluntary departures increased by 121 %, rising from 11,225 to 24,759. In 2023, the increase was even greater: they grew by 146 %, reaching 60,823.
The recovery continued in 2024, when they increased by 49 %, going from 60,823 to 90,823. This meant 30,000 additional voluntary departures in a single year.
However, in 2025 the trend reversed again. Voluntary departures fell by 10 %, from 90,823 to approximately 82,000. By 2026, the cumulative number available had decreased by another 41 %, reaching approximately 48,000.
Taken together, these data raise an important question: Why are voluntary departures declining? Is it due to changes in ICE policies, fewer people using this alternative, or the government resorting more frequently to formal deportations?
The data shows a trend that deserves attention: while deportations have increased, voluntary departures have decreased.
ICE arrests: the big increase occurred after 2021
The arrests made by Immigration and Customs Enforcement show a different trajectory than the deportations.
During the first few years analyzed, both variables moved in a relatively similar way. However, from 2022 onwards, a significant divergence began to emerge.
While deportations increased 22 % that year, arrests skyrocketed 141 %, going from 59,011 to 142,059.
In 2023, arrests continued to rise, and by 2024, they had accelerated again, reaching approximately 311,500. The biggest surge came in 2025, when arrests increased by nearly 44 % to around 450,000, the highest figure since 2014.
By 2026, the trend appears to show a slight reduction in available data. However, these figures should be interpreted with caution because they represent a partial period and cannot be directly compared to the full figures for the previous fiscal year.
The important point is that, while around 450,000 arrests and 319,980 deportations were recorded in 2025, by 2026 cumulative deportations had already reached 356,389. This reflects that arrests and deportations do not necessarily evolve at the same rate.
An arrest means that ICE takes a person into custody, while a deportation occurs when that person finally leaves the United States. Therefore, the two figures can fluctuate differently: a person arrested one year may be deported months later.
Where is Trump 2.0's immigration policy focused?
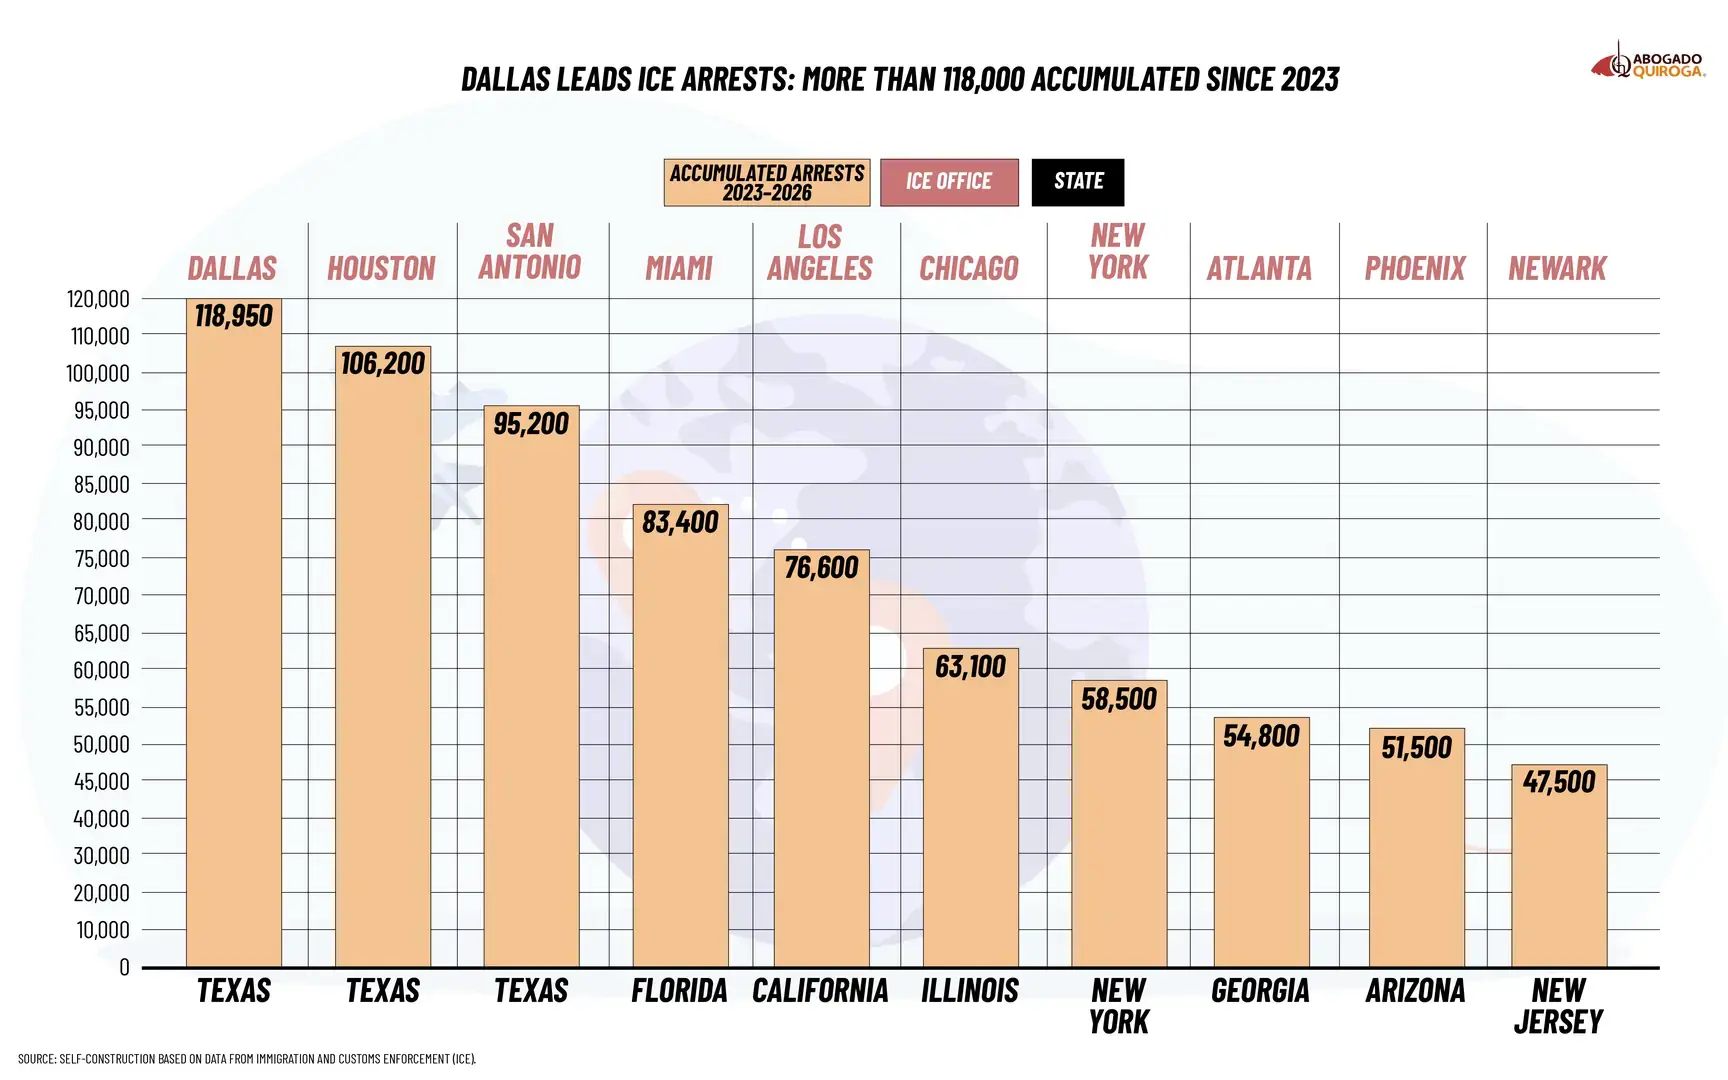
The data shows that the increase in ICE arrests has not been uniform across the United States. On the contrary, the activity has been concentrated in certain areas and large urban centers.
The figures available since 2023, which allow us to observe the trends during the final years of the Biden administration and the beginning of Trump 2.0, show a significant acceleration. Arrests rose from 166,550 in 2023 to 319,300 in 2024 and reached 481,800 in 2025.
This means that, in just two years, the volume of arrests practically tripled, reflecting a significant change in the intensity of immigration operations.
By 2026, the available figures total approximately 132,100 arrests at the analyzed offices. However, since this is a partial period, this data cannot be directly compared to the annual total for 2025.
Texas, one of the main epicenters
Texas appears as one of the main centers of this expansion. The Dallas, Houston, San Antonio, and El Paso offices accounted for 54,750 arrests in 2023, 104,700 in 2024, and 158,300 in 2025.
In 2026, although the data is incomplete, these four offices had already accumulated around 43,400 arrests. This confirms the importance that Texas maintains within this new geography of immigration operations.
The phenomenon is not limited to areas near the border. Dallas and Houston, two of the main metropolitan areas in inland Texas, also register high numbers.
Dallas tops the list within the state. Its arrests rose from 18,250 in 2023 to 34,500 in 2024 and 52,000 in 2025. For 2026, partial data available recorded approximately 14,200 arrests.
Houston followed a similar trajectory, going from 16,100 arrests in 2023 to 30,800 in 2024 and 46,500 in 2025, before recording about 12,800 in 2026.
San Antonio went from 14,200 arrests in 2023 to 27,500 in 2024 and 42,000 in 2025, while in 2026 it accumulated about 11,500.
El Paso, meanwhile, saw an increase from 6,200 arrests in 2023 to 11,900 in 2024 and 17,800 in 2025. By 2026, it was registering approximately 4,900.
The comparison shows that growth was not concentrated in a single office. Dallas, Houston, San Antonio, and El Paso all registered significant increases between 2023 and 2025.
Collectively, the four main Texas bureaus went from 54,750 arrests in 2023 to 158,300 in 2025, representing an increase of nearly three times in just two years.
This shows that Texas not only maintains a central role due to its status as a border state, but also because of the intensity of operations recorded in large cities located within it.
The expansion into other major cities
But the activity is not limited to Texas or the border states either.
Los Angeles and San Francisco, in California, together accumulated 18,300 arrests in 2023, 35,000 in 2024 and 52,100 in 2025. For 2026, the partial data available totaled around 14,300.
Miami reached approximately 36,800 arrests in 2025 and exceeded 10,000 in the data available for 2026.
Chicago reached approximately 27,800 arrests in 2025 and accumulated around 7,600 in 2026.
In New York, combining the city and Buffalo offices, more than 31,000 arrests were recorded in 2025. By 2026, the available figures already exceeded 8,700.
These data show that ICE activity reaches large metropolitan areas in the interior of the country, where there are consolidated immigrant communities, and not only territories near the border.
The behavior of the figures between 2023 and 2025 reveals a sustained acceleration in several of ICE's main offices.
Dallas went from 18,250 arrests in 2023 to 34,500 in 2024 and 52,000 in 2025. Houston increased from 16,100 to 30,800 and then to 46,500. Atlanta went from 8,200 to 15,800 and then to 24,200. Phoenix increased from 7,800 to 15,000 and then to 22,500.
The data available for 2026 should be interpreted with caution because the fiscal year is not yet closed. Therefore, it is not possible to conclude solely from these partial figures that ICE's activity will decrease compared to 2025.
Even so, the trend between 2023 and 2025 is clear: ICE arrests nearly tripled in two years, and the increase wasn't limited to border states like Texas. It also reached major cities in the interior of the country.
For immigrants, especially those living far from the border, this means that the risk of encountering immigration authorities can no longer be analyzed solely from the perspective of border states. Cities like Chicago, New York, Atlanta, Denver, Seattle, Boston, Baltimore, and Philadelphia also appear among the places with high ICE activity.
The deportation machinery has changed: ICE now looks further within the country
The shift in immigration policy during Donald Trump's second term cannot be measured solely by the number of people deported. The way ICE searches for, arrests, and detains immigrants before expelling them from the United States also changed.
According to the Deportation Data Project, ICE arrests that resulted in detention increased 4.4 times compared to the comparable period of the Biden administration.
One of the most significant changes occurred on the streets. For years, a large portion of ICE arrests began when a person was already in a local or state jail and was subsequently handed over to immigration authorities.
With Trump 2.0, ICE began targeting more people directly within communities. According to the Deportation Data Project, arrests made directly on the street increased approximately 11 times.
Another important change is that ICE no longer relies solely on its own agents. The administration has also increased collaboration with state and local law enforcement through agreements known as 287(g), which allow certain local authorities to work with ICE on immigration enforcement matters.
This changes the landscape for immigrants once again. It's no longer just about encountering an ICE agent. In some places, interaction with local police can lead to contact with immigration authorities when a cooperation agreement is in place.
Detention capacity is also changing. The Deportation Data Project estimates that the capacity used to detain immigrants increased approximately 4.5 times during Trump's second term.
At the same time, for certain groups of people without criminal convictions, the possibility of being released during the first 60 days fell from 35 % to 7 %.
The dynamics of the operations also appear to be evolving. During the first months of Trump 2.0, large-scale raids in cities and highly visible locations were frequent. However, during 2026, less visible forms of arrest have also increased, such as cases that begin with traffic stops or with the collaboration of local police.
Therefore, perhaps the most important change in Trump 2.0 is not only that there are more deportations, but that there are more mechanisms to achieve them.
ICE directly targets more people within communities, works with a greater number of local police, has greater capacity to detain immigrants, and, for certain groups, there is less chance of being released after an arrest.
To understand this new phase of U.S. immigration policy, then, it is not enough to ask how many people were deported. It is also necessary to analyze how they were found, who arrested them, and where they were detained.
It also tells the story of how much the US deportation machine has really changed.
In short: an ever-expanding deportation machine
The comparison between Obama, Trump, Biden and Trump 2.0 shows that the United States' deportation policy has gone through very different phases.
Between 2014 and 2019, deportations remained at high levels, with figures reaching 315,943 in 2014 and 267,250 in 2019.
Then came the collapse in 2020 and 2021, when deportations fell to 59,011, the lowest level of the entire period analyzed.
Starting in 2022, a new acceleration began. Deportations rose from 72,177 in 2022 to 142,580 in 2023 and 271,484 in 2024. The increase continued with 319,980 in 2025 and a cumulative total of 356,389 in 2026, a figure that already exceeds several full years of the previous period and brings the country closer again to the highest levels recorded during the Obama era.
While deportations increased, voluntary departures followed a different trajectory. They fell from 163,245 in 2014 to just 11,225 in 2021, a reduction of approximately 93 %.
Although they subsequently began to recover and reached 90,823 in 2024, they fell again to about 82,000 in 2025 and close to 48,000 in the data available for 2026.
In recent years, therefore, a scenario has emerged in which formal deportations are increasing while voluntary departures are decreasing.
Arrests also show a significant change. After hitting a low point in 2021, they began to grow rapidly: reaching 142,059 in 2022, surpassing 300,000 in 2024, and hitting around 450,000 in 2025.
For 2026, the available data is incomplete and does not yet allow us to determine how the fiscal year will end. However, the figures show that ICE's activity continues to be concentrated in a significant number of large metropolitan areas.
Furthermore, the change did not occur uniformly across the country. Texas became one of the main centers of this expansion, but growth also reached large cities far from the border.
The Dallas, Houston, San Antonio, and El Paso offices together went from 54,750 arrests in 2023 to 158,300 in 2025. Dallas, for example, went from 18,250 to 52,000, while Houston increased from 16,100 to 46,500 during the same period.
The change is also in how arrests are made. The Deportation Data Project found that ICE arrests that resulted in detention increased 4.4 times compared to the same period under the Biden administration, while arrests made directly on the streets increased approximately 11 times.
This means that ICE is looking for more people directly within communities and not just immigrants who are already in jails or who have had previous contact with the criminal justice system.
Added to this is the increasing participation of state and local police through 287(g) agreements.
This whole scenario leads to one conclusion: Trump 2.0 is not only increasing deportations, but is also expanding the machinery that allows them to be carried out.
There are more operations within the country, greater involvement of local police, more arrest capacity, and new mechanisms to locate immigrants within communities.
Although it is not yet possible to finalize the 2026 figures, the available data show that the United States is once again approaching deportation levels reminiscent of the most intense years of the Obama era, but with one important difference: the machinery for finding, arresting, and detaining immigrants now appears to be broader and more widespread within U.S. territory.
To learn more about the figures, click here and explore all the information.


